
How much do county and city governments in Virginia collect in revenues and spend each year? And what do they spend it on?
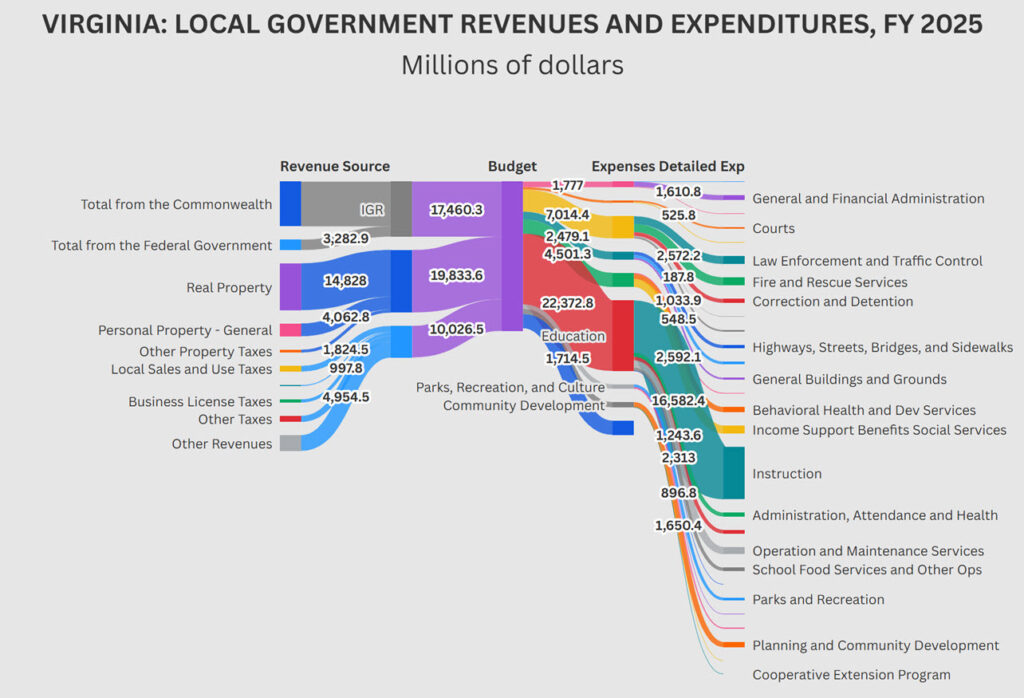
The diagram above shows the revenues and expenditures for all Virginia localities (counties and cities) together, in what is know as a Sankey diagram. This diagram shows the flow and breakdown of local revenues and expenditures in millions of dollars for FY2025 (July 2024 – June 2025) .
The interactive version of this diagram allows you to explore the revenues and expenditures for all Virginia localities in greater detail by showing the exact size of each funding flow. The interactive version also allows you to generate the diagram for each individual county and city in Virginia for FY 2025.
Interactive diagrams are also available in per capita amounts and per household amounts, so that you can see how much each local government raised and spent on different functions per person or per household in your county or city in FY2025. In addition, an interactive diagram is also available in per household per month amounts, which allows you to consider how much each local government raised and spent on different functions per household per month. These versions make it easier to compare your local government’s budget to your own household budget.
Note that the interactive diagrams are optimized for larger screens (i.e., best viewed on a desktop or laptop) and are not available on mobile devices.
The diagrams are based on data reported by local governments to the Virginia Auditor of Public Accounts each year, as required by Virginia law. However, no financial data was reported by 32 localities–as a result, their data is not included (and will result in a blank graph if selected). The number of residents and households in each county and city in Virginia was estimated based on US Census Bureau data.
Please note: this website is currently under development. The content currently available is intended to demonstrate possible use cases for citizen-oriented public-sector analysis, data visualization, and government performance communication. As the platform evolves, additional data, tools, features, and explanatory content will be added.