
Once every five years, the U.S. Census Bureau does a comprehensive survey of state and local government finances in all states. One to figure out whether government spending in Virginia is (too) high, (too) low, or about right, is to compare government spending in Virginia to other states.
In order to adjust for the fact that different states have different population sizes, such comparison are typically done in ‘per capita’ or per-person terms. And because some states rely more heavily on local governments to deliver services compared to the state government, a good starting point is to compare state plus local government expenditures by state. In order to prevent double-counting, in this analysis, we only consider ‘direct’ spending, and do not consider grants to local governments as state-level spending.
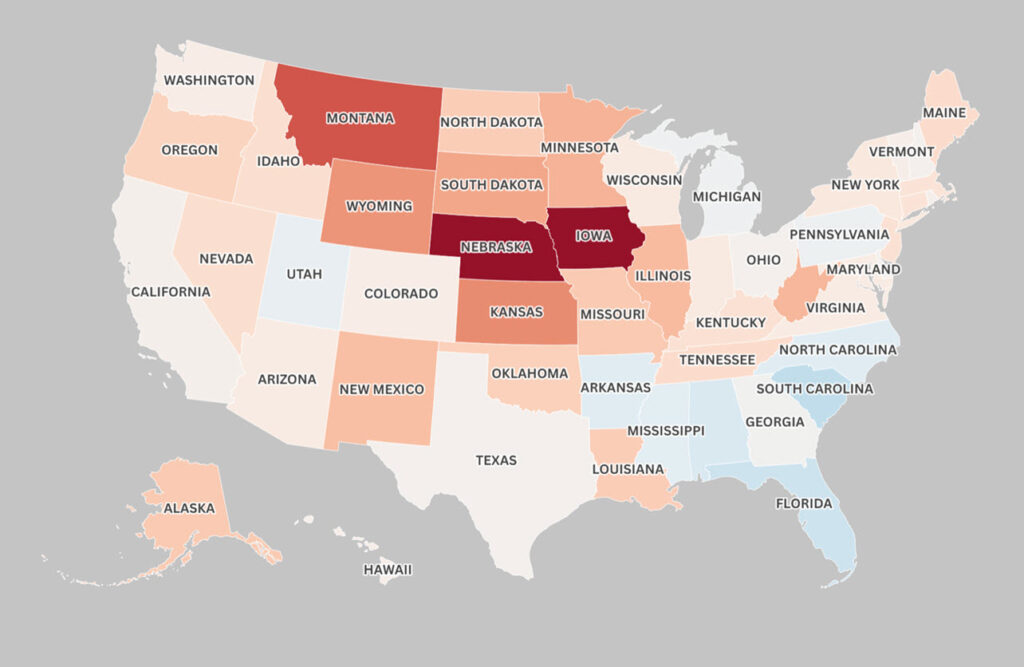
Relying on the Census of Government Finance data set for 2022, and ranking states from the highest-spending state per person (Alaska) to the lowest-spending state (Idaho) results in the following diagram:
Out of 50 states, Virginia ranked 26th in terms of state and local government expenditures in 2022, with state and local government spending 12,111 dollars per person on public infrastructure and services. The split between the state and local level is nearly even: the state government (Commonwealth of Virginia) spent 6,315 dollars per person, whereas–on average–local governments spent 5,796 dollars per person on local infrastructure and services. Virginia’s ranking and spending levels suggest a state-local public sector that is relatively balanced, moderate in size, and heavily dependent on shared responsibility between “the Commonwealth” (state government) and local governments.
At first glance, spending about $12,111 per resident on public infrastructure and services may sound high. But in practice, this figure reflects the enormous range of responsibilities carried out by state and local governments every day: public schools, roads, transit, policing, fire and rescue, public health, parks, courts, social services, water systems, libraries, community colleges, and many other services that residents and businesses rely on continuously. Virginia ranking 26th out of 50 states places the Commonwealth almost exactly in the middle nationally. This suggests that Virginia is neither a particularly high-spending nor low-spending state-local system. Compared to some Northeastern states or states with extensive public services, Virginia operates with a relatively restrained public sector. At the same time, it spends considerably more than many lower-service or lower-tax states in the South and Mountain West.
The nearly even split between state spending and local spending reveals how much Virginia depends on local governments to deliver core public services. In many states, the state government dominates public spending. In Virginia, however, counties, cities, and towns play a major operational role. This has several practical implications.
First, the quality of many public services experienced by residents is determined locally. Schools, public safety, land use, local roads, parks, libraries, and many human services are shaped not only by state policy, but by the fiscal capacity and priorities of local governments. As a result, the lived experience of government can vary substantially between communities.
Second, the balance also means that state decisions strongly affect local service delivery. Because Virginia local governments depend heavily on state funding, mandates, and legal authority, choices made in Richmond directly shape local capacity. State aid formulas, education funding, transportation allocations, and tax policy decisions all influence what local governments can realistically provide.
Third, the figures illustrate the enormous scale and complexity of local government operations. Many residents think of local governments as relatively small administrative entities, yet collectively Virginia local governments spend nearly $5,800 per resident annually. In larger counties, local governments function more like diversified public-service conglomerates, employing thousands of workers and managing billions of dollars in infrastructure and service systems.
Finally, the data also help explain persistent public tensions around taxation and service expectations. Residents often want excellent schools, safe communities, low congestion, responsive emergency services, and strong quality of life—but may underestimate the level of ongoing public investment required to sustain those outcomes. At the same time, because most public services are experienced locally while many fiscal decisions are fragmented across state and local systems, it is often difficult for citizens to clearly see where responsibilities and costs truly lie.
In short, Virginia’s spending profile reflects a decentralized public service model in which both the Commonwealth and local governments play major roles. The effectiveness of government services therefore depends not only on how much is spent, but on how well state and local systems coordinate, prioritize investments, and communicate value to citizens.