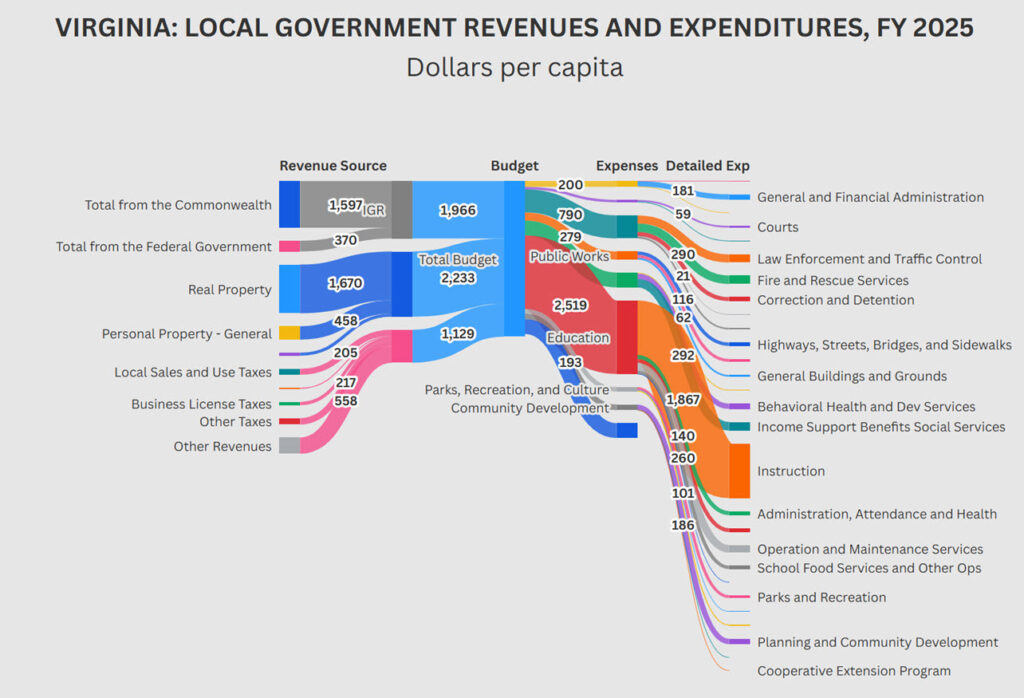
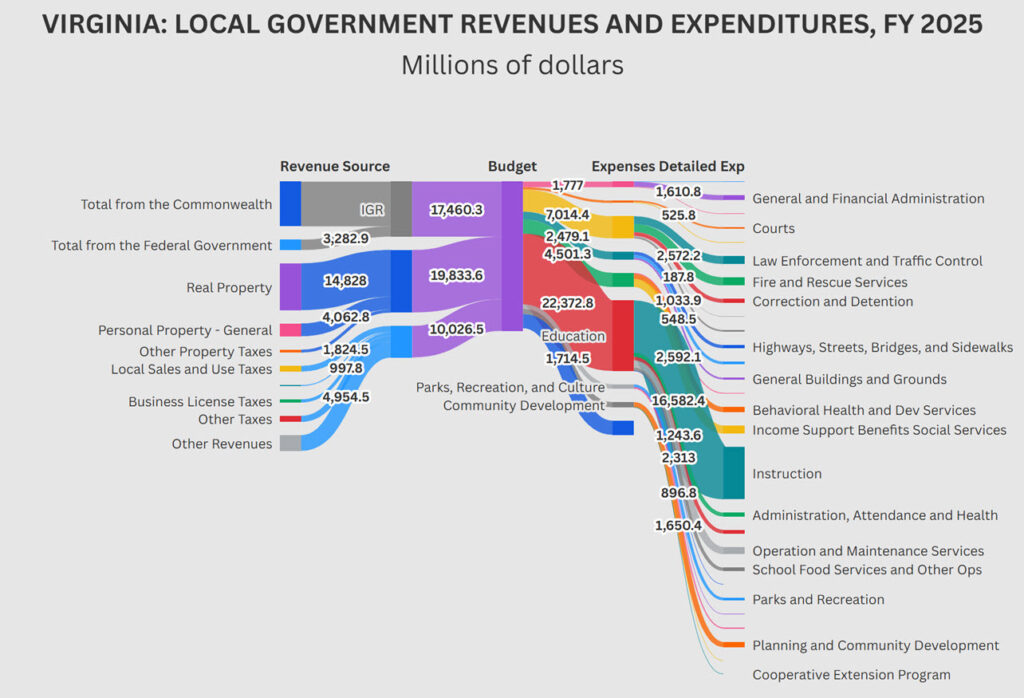
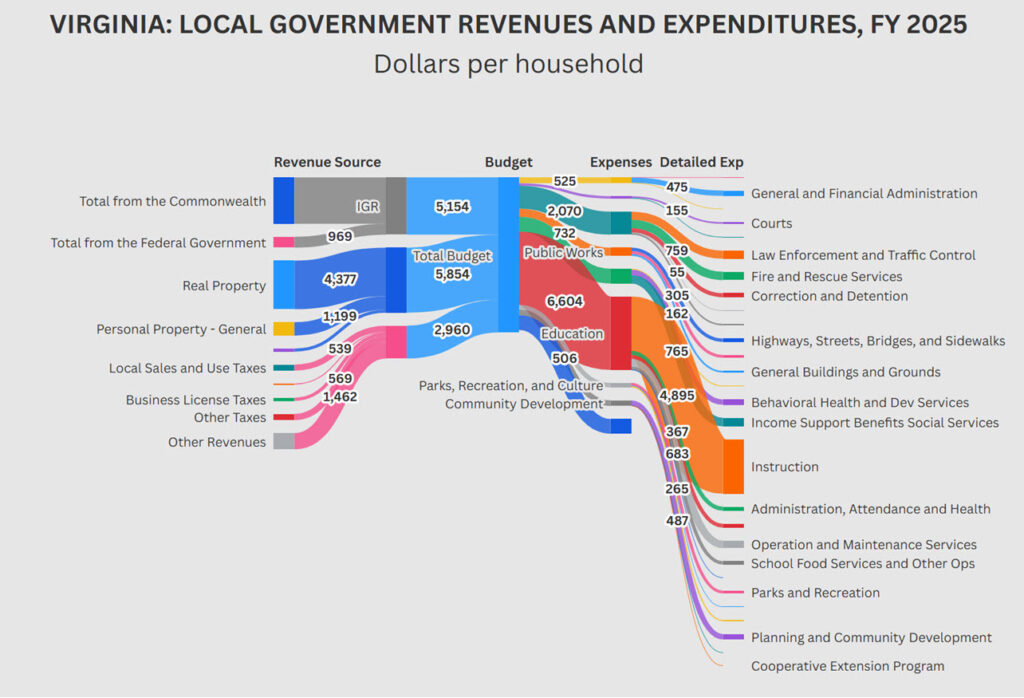
The interactive diagram below allows you to view the revenues and expenditures for all Virginia localities together, as well as for each locality (county or city) in Virginia, for FY 2025. This diagram shows local revenues and expenditures in dollars per capita. The diagram is available in other versions as well (millions of dollars / per household / per household per month). The diagram is based on data reported by local governments to the Virginia Auditor of Public Accounts each year, as required by Virginia law. No financial data were reported by 32 localities–as a result, their data is not included (and will result in a blank graph if selected).