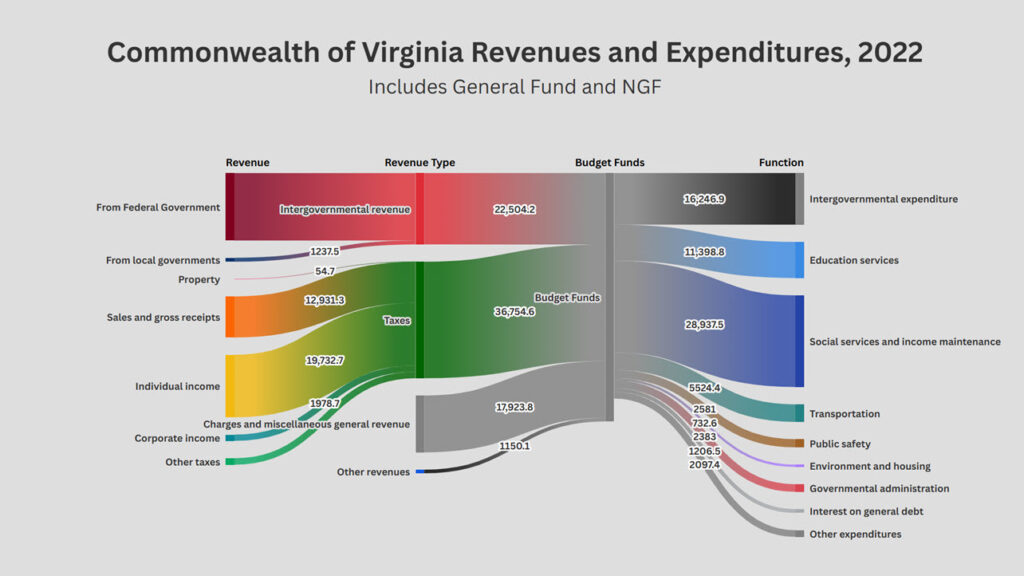
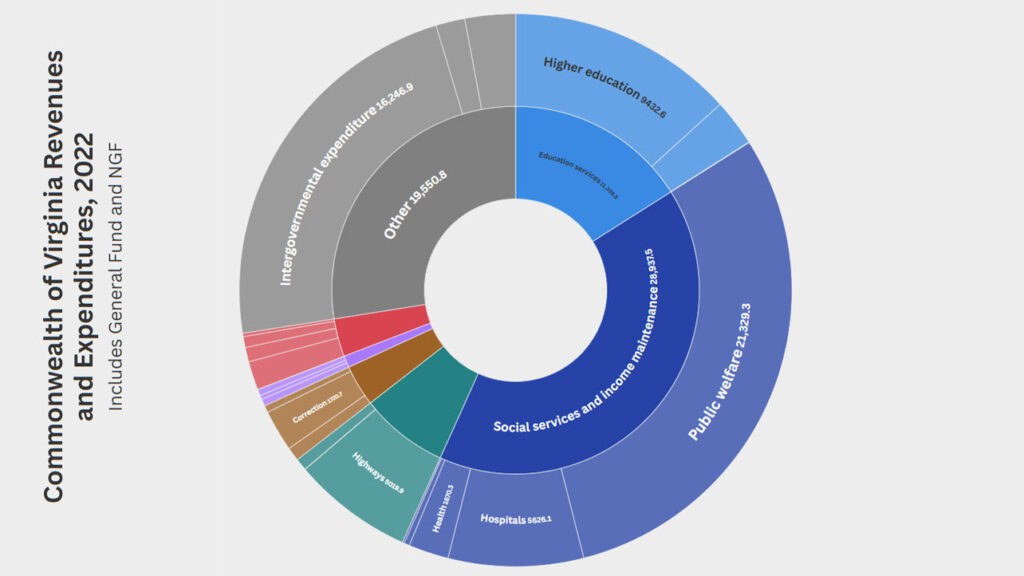
In addition to the breakdown of the Commonwealth of Virginia’s budget into major functional spending groups (shown in an earlier post), the Census of Government Finances (2022) also reports on expenditures based on over 30 sub-functions. It should be noted that this data source reports on all state government spending–not just the state’s General Fund.
These detailed expenditures are shown in the pie chart (or sunburst diagram) below. Like the earlier diagram, the sunburst diagram again allows you to select the units in which the figure is presented: millions of dollars, dollars per person (or ‘per capita’), dollars per household (or ‘per domus’), as well as per households per month. Virginia state government spending can also be presented as a percentage of total spending.
Clicking on a functional group allows you to focus on the expenditures in greater detail. In combination with the Sankey diagram noted above, this chart gives an even more detailed view of state government spending.