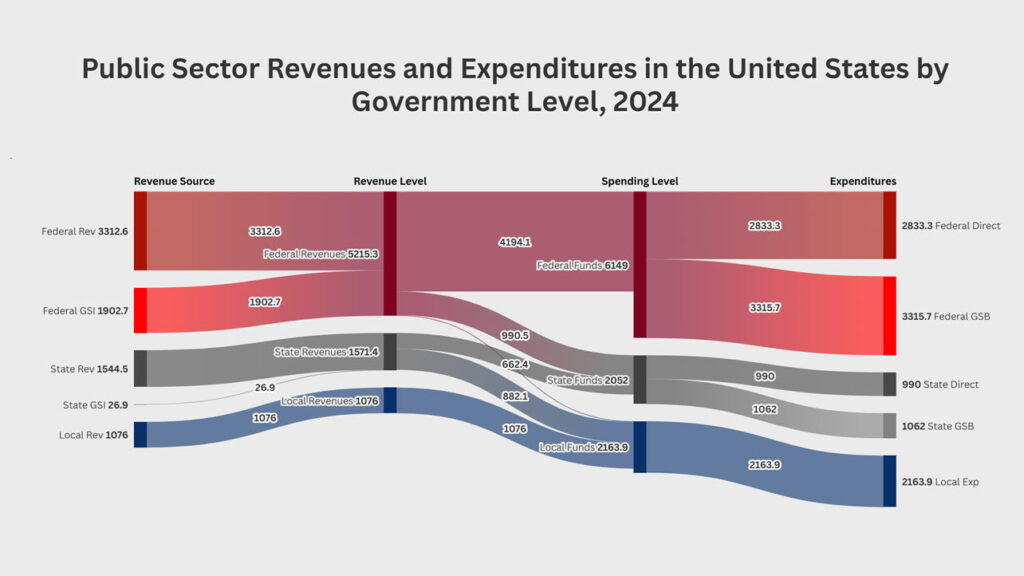
A big picture overview of fiscal federalism in the United States suggests that the federal government by itself is responsible for more than half the revenues and expenditures in the United States. So, how much do Americans pay in taxes and revenues to the federal government, and what do they get in return in terms of federal government spending programs? This analysis considers the main revenues, expenditures, and intergovernmental fiscal transfers for the Government of the United States for FY 2025, as reported by the Office of Management and Budget (OMB)Historical Tables.
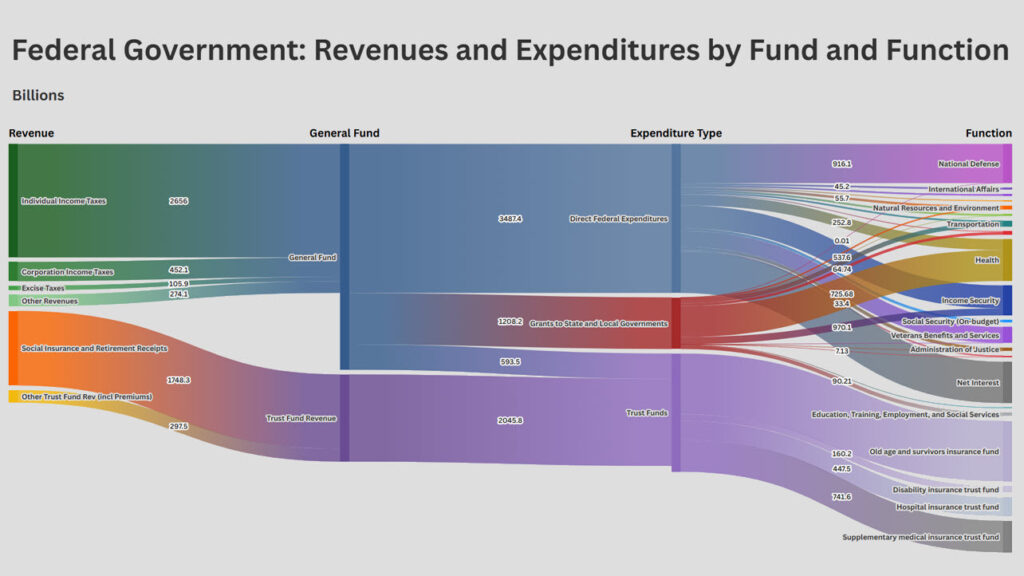
Based on the latest version of OMB’s Historical Tables, the interactive diagram below show the main revenues and expenditures for the U.S. Government. Unlike more rudimentary presentations of U.S. Government finances, the diagram clearly divides federal revenues and spending into the U.S. General Fund (i.e., the regular federal budget) and the main federal Trust Funds, including the Old Age and Survivors Insurance Fund; the Disability Insurance Trust Fund; the Hospital Insurance Trust Fund (which funds Medicare Part A); and the Supplementary Medical Insurance Trust Fund (which funds Medicare Parts B and D). For presentation purposes, smaller trust funds (such as the Highway Trust Fund) are left within the General Fund.
Failing to make the distinction between the General Fund and Trust Funds would cause any analysis of federal revenues and spending to compare apples and oranges: while taxes paid into the General Fund are used for public goods and services for all Americans, contributions and premiums paid into the main Trust Funds (such as the Social Security Trust Funds) are social insurance contributions and result in a direct benefit for the contributors themselves. Furthermore, although Congress can move addition funds from the General Fund to trust funds, revenues paid into trust funds cannot be spent by Congress on public goods or services, such as national defense or other national priorities.
In addition, the diagram clearly highlights how the General Fund is divided in practice between direct federal expenditures and intergovernmental expenditures (Grants to State and Local Governments). Finally, the diagram shows the government functions or services that federal tax dollars and federal trust fund contributions are ultimately spent on.
Note that the diagram is best viewed on wider screens, and may not display well on mobile devices.
The diagram is interactive because it allows you to select the units in which the figure is presented: billions of dollars, dollars per person (or ‘per capita’), dollars per household (or ‘per domus’ in Latin), and even per households per month. All these measures are economically equivalent and valid. However, because families generally organize their own finances in monthly terms, presenting public sector finances in terms of per households per month provides an intuitive measure of the scale of federal taxation, contributions, and public service provision.
By breaking down federal finances by both fund and function, the diagram is actually more informative than other diagrams that seek to explore federal revenue and spending patterns. The diagram shows that ‘actual’ federal budget expenditures actually amount to ‘only’ 4.7 trillion dollars (34,837 dollars per household per year) rather than 7.5 trillion dollars (55,394 dollars per household), as 2.8 trillion of ‘federal’ spending (or 20,557 per household) is actually dedicated to trust fund spending.
The diagram also clearly shows the nature of the budget deficit: although both the General Fund and the Trust Funds currently operate at a deficit, the biggest fiscal imbalance is taking place as part of the General Fund.
By allowing the revenue and expenditure amounts to be expressed in per capita and per household terms, the diagram is also more informative about how much the federal government actually spends. For instance, national defense and veteran’s affairs account for 6,797 and 2,772 dollars per household per year, respectively (or 566 and 231 dollars per month). By comparison, on average, American families spend 6,224 dollars per year (or 519 per month) on food groceries (“food at home”) and 2,411 dollars per year (201 per month) on gasoline.