
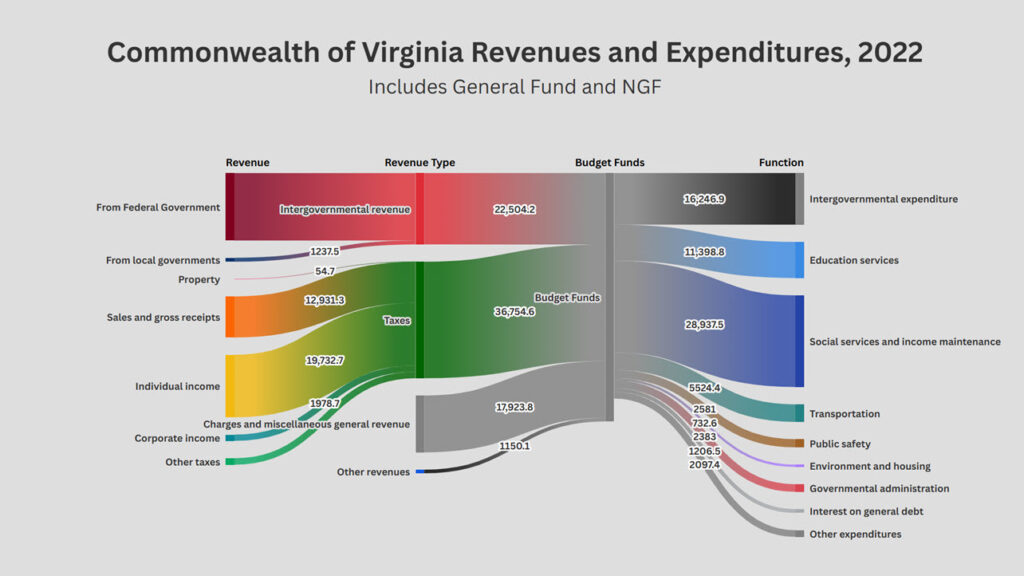
How much do Virginians pay in taxes and revenues to the Commonwealth of Virginia, and what do they get in return in terms of state government spending programs? An initial analysis considers the main revenues, expenditures, and intergovernmental fiscal transfers for the Commonwealth of Virginia, as reported by the latest Census of Government Finances (2022).
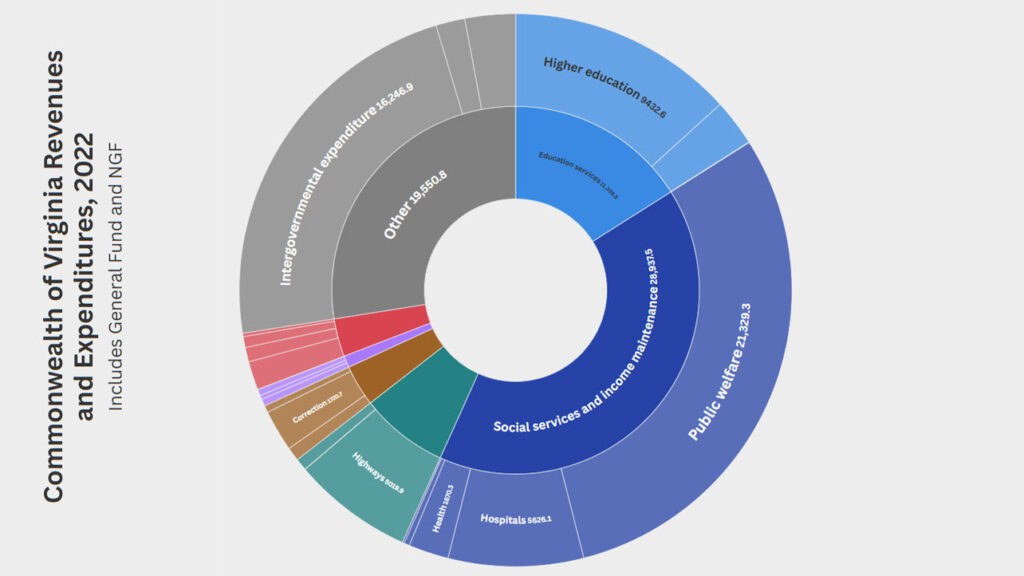
A good way to explore state government expenditures is through pie chart or ‘sunburst’ diagram. These diagrams visualize how much is spent on what functions and sub-functions or programs. This sunburst diagram allows the user to select the units in which the figure is presented: millions of dollars, dollars per person (or ‘per capita’), dollars per household (or ‘per domus’), as well as per households per month. Clicking on a functional group allows you to focus on the expenditures in greater detail.