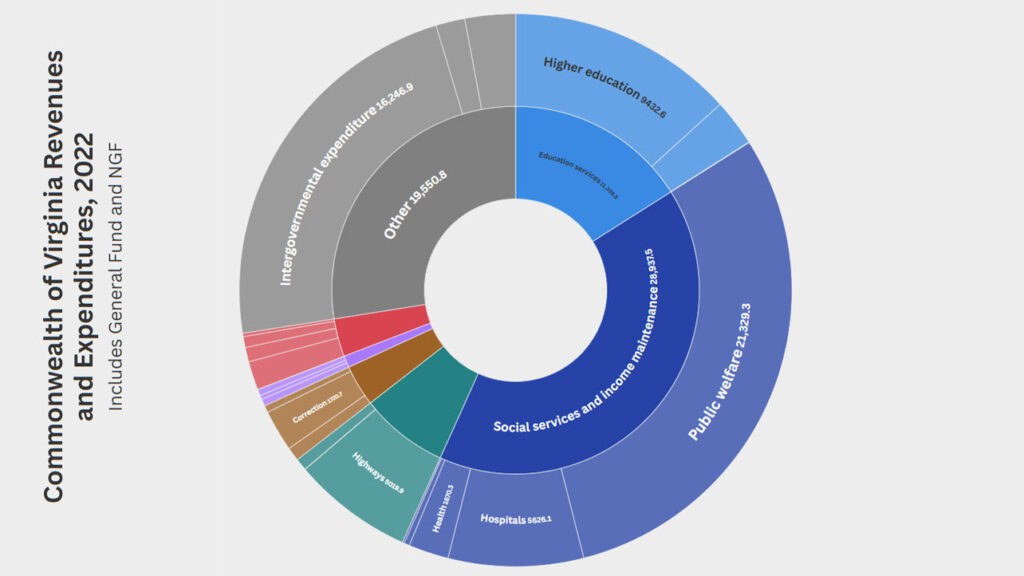
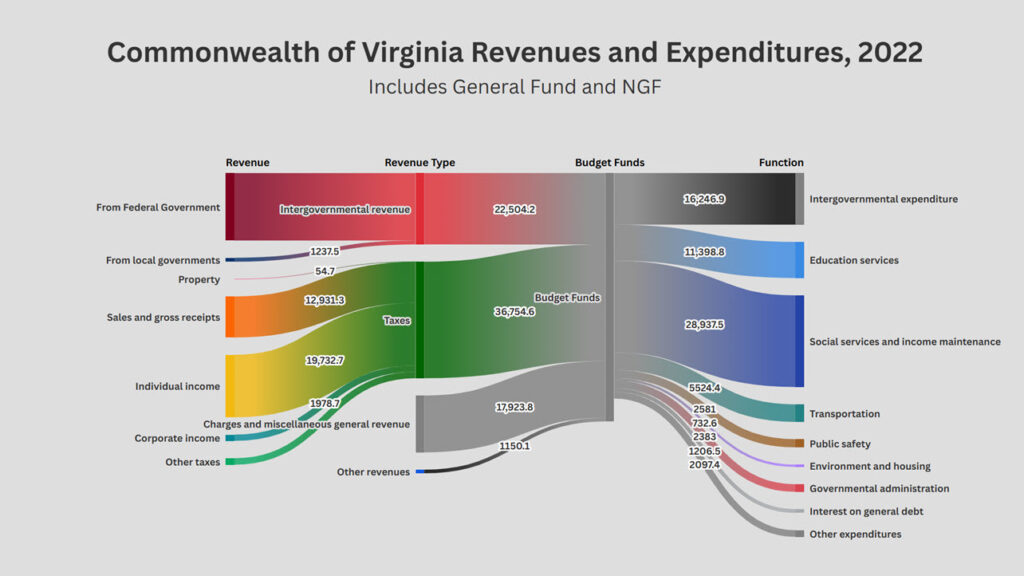
How much do Virginians pay in taxes and revenues to the Commonwealth of Virginia, and what do they get in return in terms of state government spending? Based on the latest Census of Government Finances (2022), the interactive diagram below show the main revenues, expenditures, and intergovernmental fiscal transfers–both coming in and going out–for the Commonwealth of Virginia.
The diagram is interactive
Note that the diagram is best viewed on wider screens, and may not display well on mobile devices. The diagram is interactive because it allows you to select the units in which the figure is presented: millions of dollars, dollars per person (or ‘per capita’), dollars per household (or ‘per domus’ in Latin), and even per households per month. All these measures are economically equivalent and valid. However, because families generally organize their own finances in monthly terms, presenting public sector finances in terms of per households per month provides an intuitive measure of the scale of taxation and public service provision.
Caveats
The most significant caveat with this presentation of the Virginia budget–reflecting actual revenues and expenditure for 2022–is that this financial snapshot takes into account not only the state’s regular budget–known as the Commonwealth’s General Fund–but also the state’s revenues and expenditures that are not part of the General Fund–typically referred to as Non-General-Fund (NGF) transactions.
As a result, there are things that this big-picture overview does not show. For instance, while the diagram shows that Virginia received considerable intergovernmental revenue (i.e., funding transfers) from the federal government, the diagram is unable to show that most of these resources are provided outside the Virginia General Fund, and that most of these resources are earmarked for specific social programs (mainly Medicaid and other programs). In addition, it is possible to break down state government expenditures by function into over 30 sub-functions. Nonetheless, the current graph provides a good entry-point in understanding Virginia’s fiscal picture. Further analysis–for instance, using data drawn from Commonwealth Data Point–can provide more detailed insights.
What do these diagrams reveal about Virginia’s revenues and expenditures?
The diagram show that Virginia finances its state budget through a balanced mix of state taxes, federal funding, and other revenues. These funding streams reflect the contributions made by Virginians to the Commonwealth of Virginia. In turn, the state’s expenditures reflect the benefits that Virginia households receive from the Commonwealth. The figure reveals no major fiscal imbalance. Under the Constitution of Virginia, the Governor is constitutionally required to ensure that state expenses do not exceed total revenues on hand and anticipated during the appropriation period.
By far the largest source of state revenue is taxation, which generated $36.8 billion in 2022—equivalent to approximately $11,200 per Virginia household, or about $930 per household per month. Individual income taxes are the Commonwealth’s single largest tax source ($19.7 billion, or $6,000 per household), followed by sales and gross receipts taxes ($12.9 billion, or $3,900 per household). Corporate income taxes and other state taxes together contribute another $4.0 billion. While an average Virginia household contributes almost exactly 500 dollars per month in income taxes and 328 dollars per month in sales and gross receipts taxes, the contribution made by each actual Virginia household depends on the household’s specific income and consumption levels, with some paying more and others paying less.
Federal funding is the Commonwealth’s second-largest revenue source. In 2022, Virginia received $21.3 billion in grants and transfers from the federal government, equivalent to approximately $6,500 per household (about $540 per household per month). These federal grants fund a number of specific federal programs, including Medicaid, health and nutrition programs, federal funding for higher education, and federal programs in support of K-12 education (Title I). It should be noted that federal funding isn’t free: this contribution is funded by taxpayers across the United States (including in Virginia) in proportion to their (income) tax obligation.
As the third main revenue source, Virginia raised $17.9 billion ($5,400 per household per year) through charges, fees, tuition, and miscellaneous revenues, while other revenue sources contributed a further $1.2 billion. While an average Virginia household contributed $5,400 per year through charges, fees, and similar revenues, the exact actual amount again varies considerably from household to household. In particular, these revenue are mainly contributed by the beneficiaries of specific state services (e.g., public university tuition).
On the expenditure side, social services and income maintenance programs account for the largest share of the state budget, totaling $28.9 billion, or nearly $8,800 per household (or $733 per household per month). Much of this spending reflects spending on Medicaid, nutrition programs, and other health and human services programs. Given that only roughly 1 out of 5 Virginians qualify as Medicaid recipients (or other social protection programs), this program represents a significant benefit (in excess of $40,000 per households per year in total) to the recipients or beneficiaries of these programs.
Unfortunately, non-recipients may be unaware of the sizeable benefits provided by these government programs, while recipients may not always recognize or acknowledge that these government programs are taxpayer-funded. Furthermore, as noted earlier (under caveats), most government social protection spending is not funded from the Commonwealth General Fund. As such, more in-depth analysis of government social spending in Virginia would have to be based on detailed budget data that is able distinguish in a more nuanced manner between funding provided by the General Fund and non-General Fund sources.
Next, one of the most significant features of Virginia’s fiscal system is the extensive role of intergovernmental expenditures, or intergovernmental aid to local governments, which totaled $16.2 billion in 2022—equivalent to approximately $4,940 per Virginia household, or about $412 per household per month. Although these funds support a range of local government functions, by far the largest share of intergovernmental expenditures represents aid to localities for K–12 public education. Local school divisions receive state aid through their respective local governments according to statutory funding formulas that reflect factors such as student enrollment, local fiscal capacity, and program eligibility, meaning that in practice, households in different parts of Virginia benefit from different levels of state support. This means that while, on average, Virginia localities receive a subsidy of nearly $5,000 per household per year in support of local public education and other local services, the exact amount of this benefit depends considerably on the locality in which each household resides.
After public welfare and intergovernmental expenditures, direct spending on education (mainly higher education) represents the Commonwealth’s third-largest spending item, with $11.4 billion in spending ($3,500 per household). It should be noted that—due to the nature of how the Census Bureau counts public revenues and spending—this amount reflects not only the amount of General Fund spending on higher education, but also counts expenditures funded by the tuition and fees paid for directly by beneficiaries (i.e., public university students).
Road infrastructure and transportation accounts for another $5.5 billion ($1,700 per household) in public infrastructure and services provided to Virginians. This includes local roads, as most local roads are classified as state-funded secondary highways in Virginia. This means that Virginia households, on average, benefit from highway spending to the tune of $1,500 per year, or $127 per household per month. Similarly, Virginians receive $2.6 billion (or $785 per household) in public safety services, for corrections, state police, courts, and emergency preparedness.
Beyond these major spending areas, Virginia spends $2.4 billion on governmental administration, $1.2 billion on interest payments on state debt, $0.7 billion on environmental protection and housing programs, and $2.1 billion on other governmental functions. And even though there is a widespread perception that government is highly inefficient and bureaucratic, general government administration accounts for 3.3 percent of total state spending.
Overall, the Sankey diagram above demonstrates that the Commonwealth’s budget is more than an accounting document—it is a financial blueprint for transforming state taxes, federal grants, and other revenues into a broad bundle of public infrastructure, public services, and social programs that benefit Virginians across the Commonwealth.