

HOME > EXPLORE DATA > CIVIC ECONOMICS 101
What do American households get from government—and what do they pay?
See where government revenues come from and how much is spent–at the federal, state and local levels–in the United States per household, per month
Imagine walking into a store and being asked to pay for something without knowing what you’re buying—or how much it costs. You probably wouldn’t agree to that. Yet when Americans debate taxes and government spending, we often do so without a clear picture of what government actually provides, or what we pay for it.
So, let’s make government spending numbers more meaningful. Instead of talking about millions, billions, or trillions of dollars in government spending, let’s look at government spending and revenues per household, per month. This helps compare government spending levels to how much we spend as households on housing, transportation, or groceries. Of course, different households pay different amounts in taxes and benefit from different government services, depending on their circumstances. But the national average gives us a useful starting point for understanding what government services we receive—and how much they cost.
While the exact amounts change a little from year to year, for this overview, we’ll use 2024 figures provided by the U.S. Bureau of Economic Analysis, looking at federal, state, and local governments separately, to consider: what do American households get from government—and what do they pay?
Let’s start with the federal government.
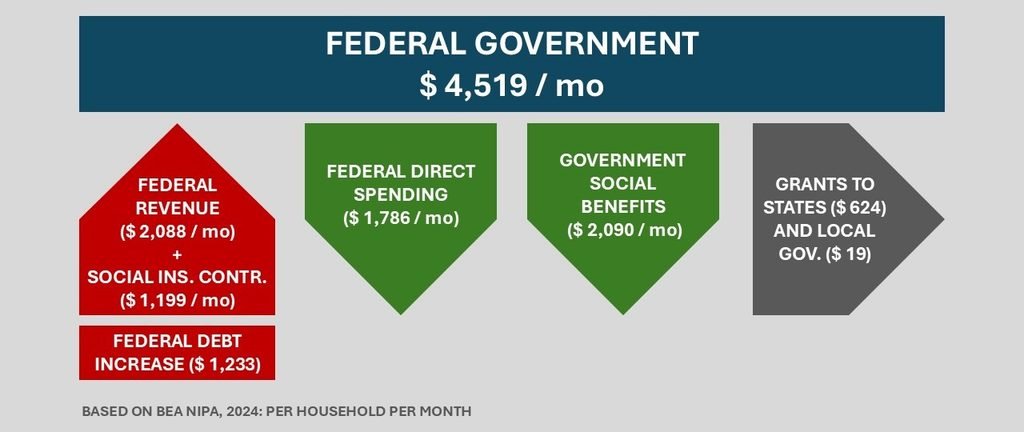
For 2024, total federal spending amounted to about $4,519 per household per month. We may believe that government spends too much on some things and too little on others—or question whether we’re getting good value for our money. But to make those judgments, we first need to understand where the money goes.
Of the total, the federal government spent $1,786 on direct federal programs and services—including national defense, the operation of federal agencies, and interest of the national debt. To put that in perspective, that’s almost as much as the average American household spends on housing each month. In addition, about $643 of federal government spending went to state and local governments to help fund state and local public services.
Another $2,090 went toward government social benefits, including Social Security, Medicare, and other benefits paid to individuals. Of course, not everyone receives these benefits at the same time. Many benefits, such as Social Security and Medicare, primarily support us when we retire, after decades of paying into the system. Other federal programs provide a safety net for families only when they face unemployment, financial hardship, or other difficult circumstances.
How did the federal government pay for all this? It collected about $2,088 per household per month in federal revenues, mainly through income taxes, plus another $1,199 in social insurance contributions, such as Social Security and Medicare payroll contributions. These revenues weren’t enough to cover federal spending. In 2024, the federal government added to the national debt, borrowing an additional $1,233 per household per month, that will at some point have to be repaid. (More detailed figures for federal revenues and spending by fund and function for FY 2025 are available here).
Next, state governments …
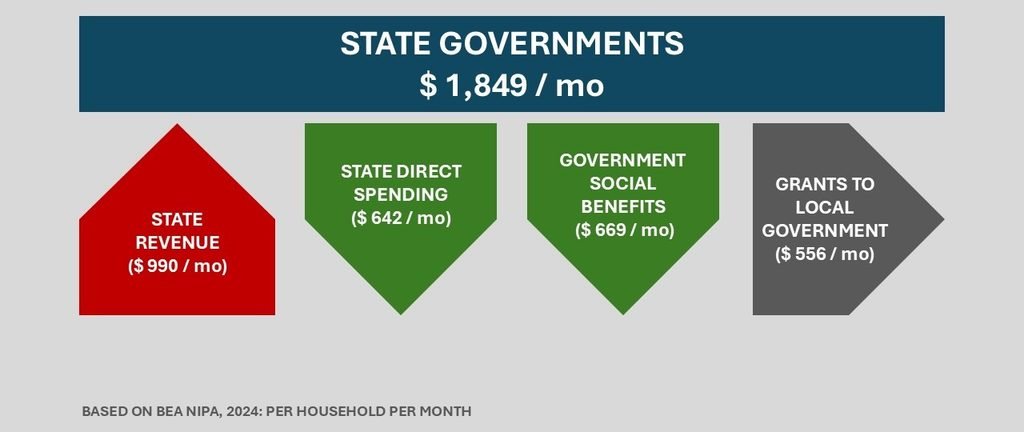
States spent approximately $1,849 per household per month. About $642 per month went toward direct state spending, including higher education, highways, public safety, and other state services. Another $669 per month went toward government social benefits, especially health-related programs such as Medicaid and SNAP (Supplemental Nutrition Assistance Program). And states transferred about $556 per household per month to local governments, helping finance public schools and other local services.
States collected about $990 per household per month in state revenues. This is less than what an average household spends on car payments, gas, and other transportation expenses each month. Of course, the exact levels of state revenues and expenditures–and the precise services they spend it on–differ from state to state. Click here to see how much Virginia families pay for dozens of state public services.
Finally, local governments …
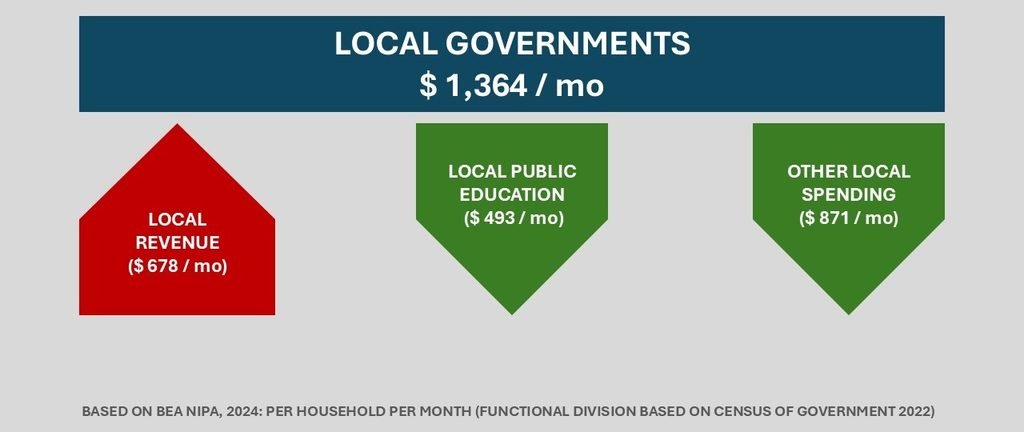
Local governments—including counties, cities, towns, school districts, and other local authorities—spent approximately $1,364 per household per month. Of this amount, roughly $493 per month went toward supported elementary and secondary schools. The remaining $871 supported a wide range of local services, including police and fire protection, roads, parks, libraries, sanitation, and other community services. Local governments raised about $678 per household per month in their own revenues, mainly from property taxes, with much of the remaining funding coming from state governments, along with some federal support.
Again, the exact amounts differ from state to state, and from locality to locality. Click here to see how much Virginia families pay for local public services each month and the benefits they receive for dozens of local public services.
What should we take away from these numbers?
A first thing worth noting is that state and local governments spend considerably less than the federal government. Yet, for most Americans, the services state and local governments provide—from public schools and roads to police, fire protection, and parks—are often the most visible and have the greatest impact on our daily lives. In other words, the level of government that spends the most is the one we interact with the least.
Another point worth noting is that some government spending is more visible than others, and some government spending benefits us directly in our everyday lives. Most of us see public schools, highways, and police officers in our daily lives. But other spending is less obvious. In fact, at both the federal and state levels, governments spend more on social benefits—including retirement income, health coverage, and food and income assistance—than on direct public services. These benefits may be less visible to households that aren’t currently receiving them, even though this government spending directly benefits families within our communities and states.
Third, we often don’t see money that flows between levels of government. Federal grants help finance state programs, and state grants help finance local services. So we cannot simply add up government spending at each level without counting some of the same money twice. And we need to recognize that federal taxes collected in one state may end up paying for public infrastructure or social programs for residents in another state.
And finally, informed choices about government requires understanding both sides of the equation: what services we receive, and what they cost. Conversations about whether we believe taxes should be higher or lower, or government should do more or less, should start with a common understanding of the facts. Unfortunately, governments at all levels have not done a particularly good job of making this kind of information accessible and understandable to ordinary citizens.
Without a clear understanding of what government does, how much public services cost, and what value they provide, we should be careful about making sweeping claims that government spends too much, that taxes are too high, or that government is inefficient or corrupt. Having a solid understanding how governments raise and spend public money—including some of the basic facts and figures on government spending and taxation—is therefore an essential part of civic education and informed public debate.